Telling you all we know – conversations about Climate Change on Mornington Peninsula
Abstract
Mornington Peninsula Shire recently conducted a series of climate change conversations with their residents around a project on the likely climate change impacts that could be expected in the region. They were highly successful, attracting an aggregated audience of almost 3000 people. In large part, the nature of the program that the Shire developed was responsible for the success.
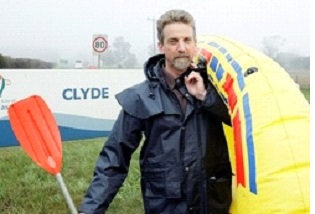
Man the lifeboats read the caption to the photo below which appeared in the Cranbourne Leader on the release of the Western Port Greenhouse Alliance (WPGA) report People, Property and Places – Impacts of climate change on settlements in the Western Port Region. The photo shows City of Casey ex-mayor Colin Butler preparing for the sea level that the report describes. Whether the sea level rise the report projects will really require that a rubber ducky be readied now, however, is not the immediate conclusion that most would draw.
But how should members of the community, rightly concerned that climate change will bring a range of consequences to their region, make appropriate responses? What are the consequences of climate change and what is the range of responses that communities can make?
The WPGA project, reported upon in People, Property and Places – Impacts of climate change on settlements in the Western Port Region, set out, in its first phase, to investigate these consequences. As one of five national adaptation projects funded by the Australian Government’s Department of Climate Change, with additional funding from the Victorian Government’s Department of Sustainability and Environment, the WPGA conducted the project in four phases:
(i) projecting changes to key climate drivers and associated biophysical impacts in the region. Changes examined included sea level rises, average and extreme rainfall, storm surge, temperature and fire weather. Outputs of this phase are provided in three biophysical impacts reports, available on www.wpga.org.au. This phase of the project was conducted by the Commonwealth Scientific and Industrial Research Organisation (CSIRO).
(ii) examining the nature and extent of potential impacts to the region’s built environment (land, housing and public and private infrastructure) as well as an assessment of the social and economic implications of the impacts and the vulnerability of different localities and groups. Marsden Jacob Associates (MJA) conducted this phase of the project, with input from CSIRO.
Mornington Peninsula Shire
| Climate variable | Indicative change* | Exposed people** | Exposed property and infrastructure** | |
| Temperature | 2030 | 2070 | § entire population, especially 27,000 elderly | § most roads
§ most railways lines § some building materials § buildings or services that require cooling |
| Average annual temperature | ↑ 0.5-1.3°C | ↑ 1-3.5°C | ||
| Days per yr > 30 °C (16 current) | ↑ 1 – 5 | ↑ 4 – 16 | ||
| Days per yr > 40 °C (0 current) | ↑ 1 | ↑ 2 | ||
| Average rainfall | 2030 | 2070 | § entire population | § municipal parks and gardens
§ playing fields § water & wastewater infrastructure § other infrastructure on clay soils |
| Average annual | ↓ 0-8 % | ↓ 0-23 % | ||
| Catchment stream flows (worst case) | ↓ 25 % | ↓ >50 % | ||
| Droughts | ↑ frequency & severity | |||
| Extreme rainfall | 2030 | 2070 | § up to 530 people
§ does not include most areas on Port Phillip Bay side due to gaps in flood hazard mapping |
§ 204 residential properties (~ 100 dwellings)
§ 50 commercial and industrial properties § public infrastructure including schools,, halls § reserves and parks § 128 km of roads, 8 bridges § water and drainage infrastructure |
| 2 hour | ↑ 25 % | ↑ 70 % | ||
| 12 hour | ↑ 22 % | ↑ 61 % | ||
| 24 hour | ↑ 17 % | ↑ 50 % | ||
| 72 hour | ↓ 2 % | ↑ 48 % | ||
| Maximum flood heights | ↑ | ↑ | ||
| Flood return intervals (ARI) | ↓ flash
↔ riverine |
↓ flash
↓ riverine |
||
| Sea level rise / storm surge | 2030 | 2070 | § 1,400 people
§ due to coarse resolution of models, people and properties exposed to inundation may be understated, particularly on Port Phillip Bay
|
§ 637 residential properties
§ approx. 30 commercial and other properties § most beaches and foreshore reserves including Mt Eliza, Rosebud, Rye, Somers § most boating facilities § 45km of roads including sections of Nepean Highway |
| Sea level rise | ↑ 0.17 m | ↑ 0.49 m | ||
| Storm tide – max. height, 1:100 year ARI (current 1.14m, Rosebud) | 1.35 m | 1.78 m | ||
| Storm tide – max. height, 1:100 year ARI (current 2.09m, Somers) | 2.28 m | 2.74 m | ||
| Storm surge – change to 1:100 year ARI | ↓ to
1:40 – 1:10 |
↓ to
1:20 – 1:2 |
||
| Inundation area Port Phillip*** (1:100 year storm surge) | 0.8 sq km | 1.5 sq km | ||
| Inundation area Western Port (1:100 year storm surge) | 2.6 sq km | 3.3 sq km | ||
| Fire weather | 2030 | 2050 | § up to 34,000 people, mostly in urban fringe, semi-rural areas adjacent to bushland | § 13,500 residences
§ 185 commercial and industrial properties § 4,500 public use and unspecified including schools, medical facilities and numerous reserves § 568 km of roads |
| No. of very high and extreme forest fire risk days (~ 9 days current) | ↑ 1 – 2 | ↑ 5 – 7 | ||
| No. of very high and extreme grass fire risk days (~ 95 days current) | ↑ 7 – 15 | ↑ 9 – 30 | ||
* Key to climate changes:
↑ increase; ↓ decrease; ↔ no significant change.
| Most sensitive locations | Economic
and social impacts |
Vulnerable sectors | Vulnerable groups | |
| § inland areas (particularly urban)
§ areas with high concentrations of elderly and infants (eg. West Rosebud) |
§ increased mortality and morbidity in vulnerable groups
§ increased infrastructure maintenance costs § disruptions to transport networks § increased risk of food and water born disease outbreaks § increased summer peak demand § increased cooling costs |
§ transport
§ construction § local government services such as child care, environmental health |
§ elderly (27,000)
§ infants (8,000) § residents in low quality housing (e.g. rental) or low income households |
|
| § areas not connected to mains supply
§ high water requirement sites § wetlands, heritage gardens and other reserves |
§ increased water prices
§ increased reliance on non-traditional supply sources § access to water for some activities (possibly) § viability of some water dependent businesses and activities § increased maintenance costs, some infrastructure |
§ nurseries, garden services, etc
§ local government services such as parks, recreation § water suppliers and retailers |
§ households not connected to mains supply § low income households (possibly) |
|
| Western Port Bay
§ Crib Point, Hastings, Shoreham and Stony Point
Port Phillip Bay § data incomplete
|
§ increased flood damage to public infrastructure, especially roads and bridges
§ increased flood damage costs to residential and commercial buildings § disruption to transport § increased emergency services demand and costs |
§ local government
§ transport § residential |
§ low income households
§ businesses and properties without adequate insurance § residences with limited freeboard above 1:100 year flood (e.g. <300 mm clearance) |
|
| Western Port Bay
§ Hastings, Stony Point, Crib Point § Shoreham, Balnarring
Port Phillip Bay § Balcombe Creek, Dromana Bay, Safety Beach, Dunns Creek, West Rosebud |
§ partial or (in worst case) complete loss of land values in affected areas
§ major amenity impacts associated with damage to or loss of beaches and foreshore reserves § impacts on businesses dependent on beach related tourism § increased insurance costs or lack of access to insurance § costs associated with beach and foreshore maintenance (e.g. beach renourishment) |
§ tourism
§ recreation and boating § local government |
§ low income households
§ elderly households |
|
| § urban fringe, semi-rural and rural areas scattered throughout Shire, especially bushland and adjacent areas | § increased damage costs to residential properties
§ health impacts including loss of life and air quality § increased emergency service costs § stress, social disruption |
§ residential
§ emergency services § local government § transport |
§ people living in older housing (in exposed areas)
§ properties that have not been adequately prepared § low income households |
Absence of number next to arrow indicates magnitude of change has not been quantified. **
Based on current (2006) population and projected changes to 2070. *** Subject to uncertainty.
(iii) identifying and developing a priority list of risks to local governments associated with the impacts. A series of risk assessments, led by Broadleaf International and involving upwards of 60 council staff, were undertaken with each of the region’s local councils. These reports were prepared for internal use and incorporation into the work programs of each local council.
(iv) adaptation options and barriers to effective response to the high priority risks were explored with local councils, state government and other key regional decision makers. The adaptation responses available to councils, whether policy responses, engineering responses or behaviour change as a consequence of community activity, are canvassed in the report Impacts of climate change on settlements in the Western Port Region – Climate Change Risks and Adaptation Report, also available on wpga.org.au.
The report was released on June 26, 2008 with the publishing on the WPGA website, of a range of project outputs. These were, from the first and second phases:
Executive Summary of the People, Property and Places report
People, Property and Places – Full report
Storm Surge Biophysical Report
Answers to Frequently Asked Questions
and from the fourth phase:
Climate Change Risks and Adaptation Report
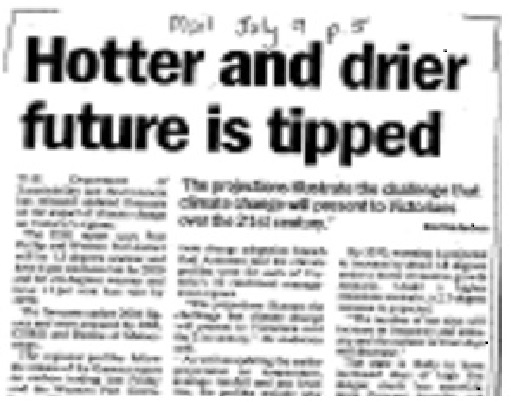
The headline above was not the only negative piece to hit the local press. The Mornington Peninsula Leader called the report a ‘doomsday report’ while the Mail tipped a ‘hotter and drier future’.

 |
The Age (26/06/08) carried a page 4 article titled Climate change threatens havoc for Western Port while local radio stations featured interviews and news grabs for their communities. The WPGA received a number of phone calls from concerned community members. “I am involved in a coastal development – mate, should I be going ahead?” “If my house, right on the beach on Philip Island, gets washed away, who can I sue?”
The projected changes that the CSIRO modelling had shown clearly provoked community interest.
Responses to the reports were the domain of each of the WPGA member councils. Bass Coast Shire and Cardinia Shire are working through the possible responses that they can make, the City of Casey and Frankston City Council have established cross-council Climate Change Taskforces to consider the responses across the full range of council operations (land use and planning, coastal planning and management, asset management, emergency management, drainage and catchment management, transport planning, community services, public health, education and recreation planning) while Mornington Peninsula Shire commenced their response with a public engagement program.
They prepared a booklet for their residents Climate Change: what we are doing about it. This was distributed in a special edition of the Shire’s newspaper Peninsula Wide, with the booklet in a plain brown envelope labelled ‘Important information inside’. Also inside was a poster with the dates of 12 community Climate Change Conversations at which data from the report would be discussed.
Twelve such conversations were planned, one in each of the council’s wards plus another in a particularly large ward. Mornington Peninsula Shire is a popular holiday destination, with many beaches, golf-courses and vineyards. It has many holiday houses nestled in the coastal vegetation and it has areas with social housing. It has an extremely diverse population. The conversations were planned for the early evening, between 6 and 8 pm, on weeknights and on Saturday mornings from 10 am – 12 noon in settlements where there were significant numbers of weekday city dwellers and weekend peninsula residents. It is common practice in Mornington Peninsula Shire to hold these weekend meetings as weekend residents have made clear their desire to be involved in Shire activities.
The program was also posted on the council’s website, letters were sent to each resident and to service clubs, sporting groups and schools. Advertisements were placed in local papers and posters were displayed in shopping centres. It was planned that show bags, containing information brochures, a shower timer, CFL, a voucher for a compost bin and an evaluation sheet, would be handed out to each attendee. Council initially allocated a budget sufficient to cater for 1000 such bags.
The program was as follows:
6/8 Rye Civic Hall (6 pm – 8 pm) approx. 230 attended
7/8 Rosebud Council Chamber (6 pm – 8 pm) 320
13/8 Mornington Council Chamber (6 pm – 8 pm) 350
14/8 Red Hill Primary School Hall (6 pm – 8 pm) 170
15/8 Mt Eliza Community Centre (6 pm – 8 pm) 220
19/8 Dromana Community Centre (6 pm – 8 pm) 180
22/8 Tootgarook Community Centre (6 pm – 8 pm) 160
23/8 Sorrento Community Centre (10 am – 12 pm) 160
26/8 Somerville Mechanics Hall (6 pm – 8 pm) 170
30/8 Flinders Civic Hall 10 am – 12 pm 140
3/9 Baptist Church, Mt Martha (6 pm – 8 pm) 310
4/9 Hastings Hall (6 pm – 8 pm) 240
Three of the venues were changed to cater for these unexpectedly large crowds. I attended the fourth conversation, relocated from the Community Hall at Red Hill. This meeting was held on a cold and wet Thursday night during the first week of the Beijing Olympics, a night of swimming finals so there were only 170 people present – only 170!
The same 2 hour program was followed at each venue and included a range of components.
(i) arrival, informal chat with friends and something to eat and drink
- welcome and introduction
- performance by students, with the subliminal orientation in people’s minds to the future
- credible, clearly explained, research-based information, presented by word and image
- direct responses to personal questions within the context of the research
- open discussion with the entire audience
- information and materials to start household responses when they returned home
Residents arrived, were greeted by council staff, given a yellow Post It note and invited to sandwiches and a cup of tea, with cordial for the kids. While they catered to their physiological needs, they thought over the issues in their minds regarding climate change in general or perhaps something that they were concerned about in particular, perhaps climate change impacts on their own home or property or their consumptions habits or actions. They wrote the issue of most concern to them on the Post It note and placed it on large pages of butcher’s paper, bearing the headings Climate Change Impact, Household Actions or Political Actions. As they ate, drank and chatted, these Post It notes were regularly removed and taken up to council staff for typing onto a desk top and linking to any one of the approximately 70 thumbnails of a PowerPoint presentation that ranged over all of the CSIRO data and the socio-economic impacts that resulted.

Council staff transcribing questions for the presentation as the crowd assembles
Through this, individual concerns could be treated within the context of the climate change impacts that created them when the general discussion started.
After twenty minutes, MC and Shire CEO Dr Michael Kennedy, invited participants to be seated. The first component of the program was a performance by a local school regarding their sustainability program. With colour, movement and the cherub’s hopes for the future, the evening started in a very positive mood. The Ward Councillor welcomed the participants to their ward meeting and briefly outlined the program to be followed, including the agreed finish time. Participants knew precisely what the time commitment would be. The MC then described the project and the commitment of the shire to climate change responses. Council officers with responsibility for environmental management then took over and gave a detailed presentation of the biophysical projections that the CSIRO developed – temperature, average rainfall, extreme rainfall, sea level rise and storm surge and fire weather – and the socio-economic impacts that project partner MJA described. The relevant questions that participants posed and placed on Post It notes were then addressed, within the context of the climate change issue or impact that prompted them.
Progressively, each of the bio-physical impacts and the participants questions were addressed, with program MC as timekeeper. With 15 minutes to go, roving microphones enabled questions from the floor to be addressed so that issues that arose in participants’ minds through the presentations could be answered.
The course of the conversation varied at venues however, as the questions raised on the Post It notes influenced the topics discussed. The roving microphone that was used after the council staff presentation in the first three sessions was brought into use during the staff presentations in all of the subsequent sessions so that questions asked by audience members could be answered within the context of the climate change impact of concern.
The program concluded promptly at the advertised finishing time so participants could meet all of their personal obligations to family and baby-sitters, for example. Those with the time stayed behind to chat, ask individual questions and often approach council staff to express their gratitude for the program. The school hall was packed up and the crowd had entirely dispersed by 8.30 pm.
As participants left the meeting, council staff handed them their gift bag and collected from them a completed evaluation sheet for council staff’s subsequent analysis of the advice for further action that they contained. At the completion of the program, a group within the council has been assembled to consider the next activities that should be developed; having raised expectations the challenge before Mornington Peninsula Shire now is to meet them.
Word spread around the local government sector that something significant was happening on the Peninsula. Councillors and council staff from other councils attended sessions to observe events.
As an exercise in sharing information with the community and providing opportunities for engagement with and internalising information, it was exemplary. Participants could have confidence that their commitment in attending a two hour session would be honoured. The meetings were tightly chaired, the program was kept to yet there was the capacity to respond to individual concerns. Respect was paid to the issues that people had, there was the flexibility to respond to issues that were raised during the program as contexts were explored. The program was relatively fast-moving with segments in different styles.
Over 1,700 evaluation forms were returned and the Shire received 80+ letters and emails. There was comprehensive coverage of the program in the local papers and its also scored 2 minutes on television. Andrew Bolt, the resident climate change sceptic at Victoria’s daily Herald Sun wrote about the program under the heading ‘Scare tactics make me sick’. He was castigating the council for alarming residents.
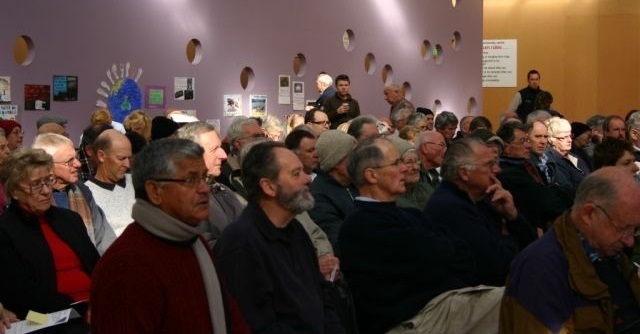
As good as the program was, there are some issues to be considered. The photographs below show the crowd at the Sorrento Community Centre on August 23 and Somerville Mechanics Hall on August 26. This is not a random cross-section of the peninsula population.
From the returned evaluations, less than 3% of the participants were below the age of 25, 18% were between 25 and 49, 18% were between 50 and 59, 32% between 60 and 69, 27% between 70 and 84 while 2% were over 85.Was this under-representation from young families a result of the scheduling? Were there other reasons? It would be very helpful to know. This is not, however, an issue for this program only. Across the environment sector, young families are the missing demographic.
Almost 3,000 people attended these sessions. This is an exceptionally strong attendance and would generally provoke hearty applause all around. Yet there are 140,000 residents in Mornington Peninsula Shire, so 137,000 people didn’t attend. Could a different marketing program have attracted more of these?

The questions from the audience were generally thoughtful, related to the big picture issues that were being presented and they explored the nature of useful responses to climate change. However, there were also questions of a different scale. For example, “Will I have to pay for the water that I have collected in my tank?” “What is the future of burning off on the peninsula? “Why hasn’t the council done something about public transport along my road?”
When there is little other opportunity for residents to talk face-to-face with council leaders, it is to be expected that an opportunity when presented would be taken.
Two responses arise to this issue. More frequent meetings of the town-hall variety would allow residents to talk with their council and develop a more comprehensive understanding of the relative responsibilities that each has. At climate change, and indeed other, public meetings such as these, skilful chairing can balance the need for individual satisfaction with keeping the question and answer sessions relevant to as many in the audience as possible.
These issues aside, it was very much a successful exercise in public awareness raising, communication and public education. Participants now know much more about the likely impacts in their regions and they have started thinking about how they might be involved in responding to them. They know what their local council is doing and they know some of the people who are doing it.
Participants were asked who did they think was responsible for tackling climate change? Their responses: individuals – 28%, local government – 14%, state government – 14% and federal government – 44%. There is a clear demand for government leadership and the community, at least those who took part in this exemplary program in community engagement, are prepared to play a part.
The conversations were a great start. But they are just a start!
Greg Hunt
Executive Officer
Western Port Greenhouse Alliance
ghunt@casey.vic.gov.a